21. Solution: Detecting Overfitting and Underfitting
Solution: Using Learning Curves to Detect Overfitting and Underfitting
Congratulations! That was not an easy quiz. Here are the curves you should have obtained:
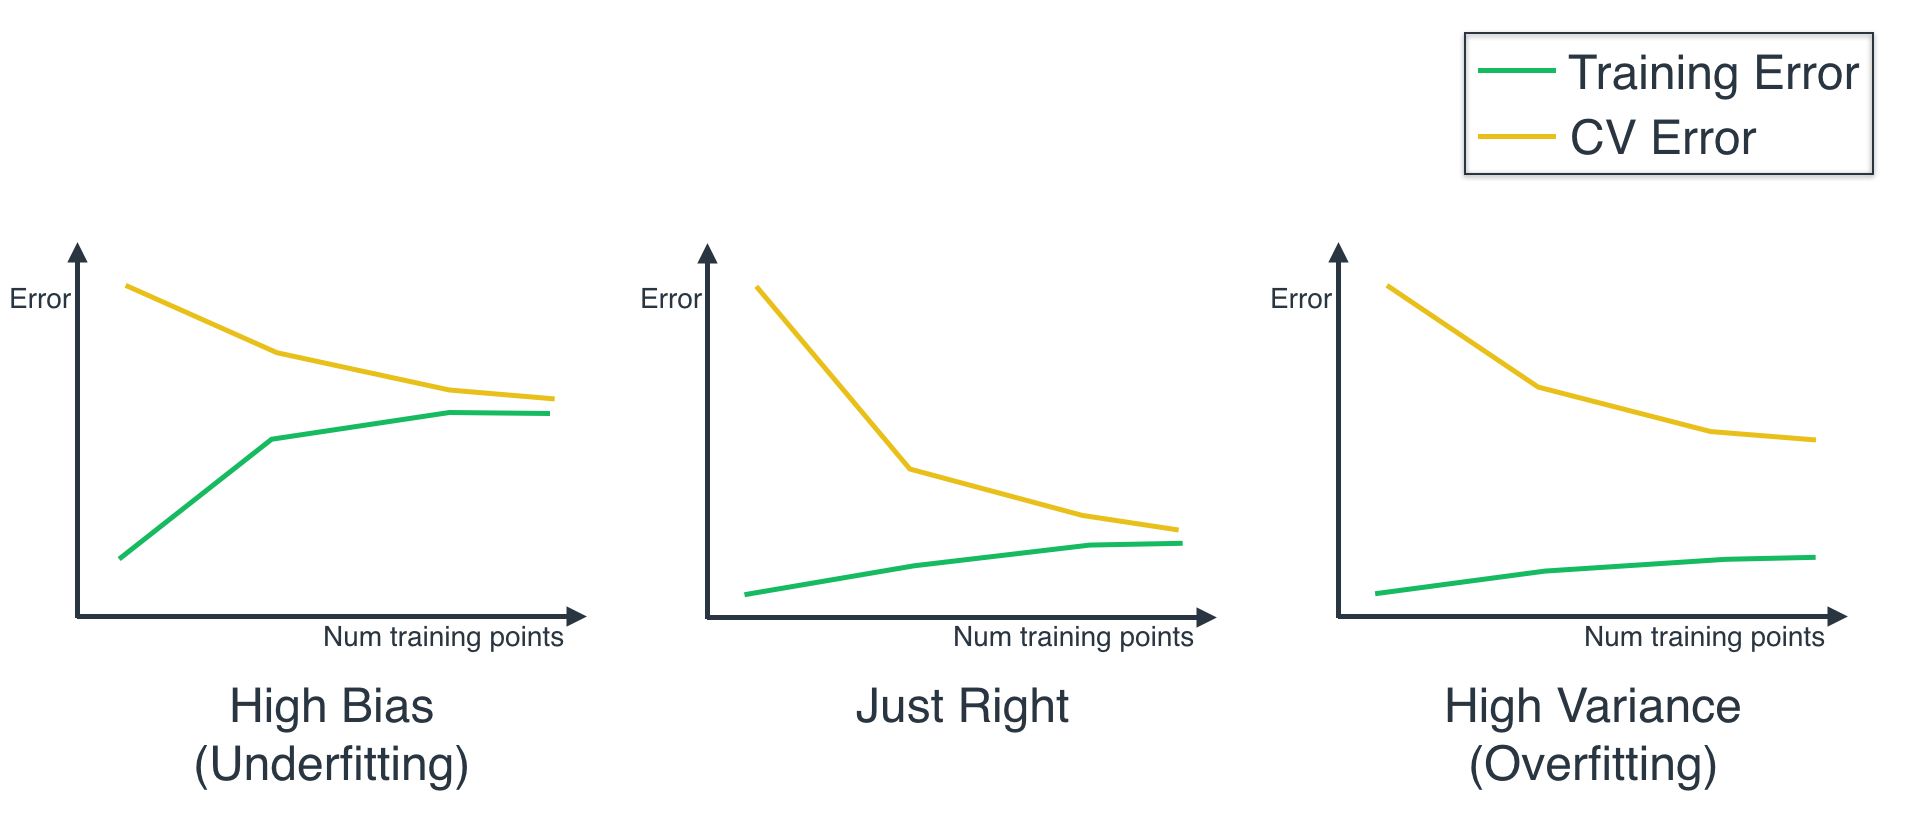
We can observe from the curves that:
- The Logistic Regression model has a low training and testing score.
- The Decision Tree model has a high training and testing score.
- The Support Vector Machine model has a high training score, and a low testing score.
From here, we can determine that the Logistic Regression model underfits, the SVM model overfits, and the Decision Tree model is just right.
Equivalently, we can flip this curves (as they measure score, and our original curves measure error), and compare them with the following three curves, we can see that they look a lot like the three curves we saw before. ( Note: The fact that we flip the curves doesn't mean that the error is 1 minus the score. It only means that as the model gets better, the error decreases, and the score increases.)
Now, we should check if this is visible in the actual model. When we plot the boundary curves for each one of these models, we get the following:

When we look at the models above, does it make sense that the first one underfits, the second one is right, and the third one overfits? It does, right? We can see that the data is correctly bounded by a circle, or a square. What our models do, is the following:
- The Logistic Regression model uses a line, which is too simplistic. It doesn't do very well on the training set. Thus, it underfits .
- The Decision Tree model uses a square, which is a pretty good fit, and generalizes well. Thus, this model is good .
- The Support Vector Machine model actually draws a tiny circle around each point. This is clearly just memorizing the training set, and won't generalize well. Thus, it overfits .
It's always good to do a reality check when we can, and see that our models actually do have the behavior that the metrics tell us.